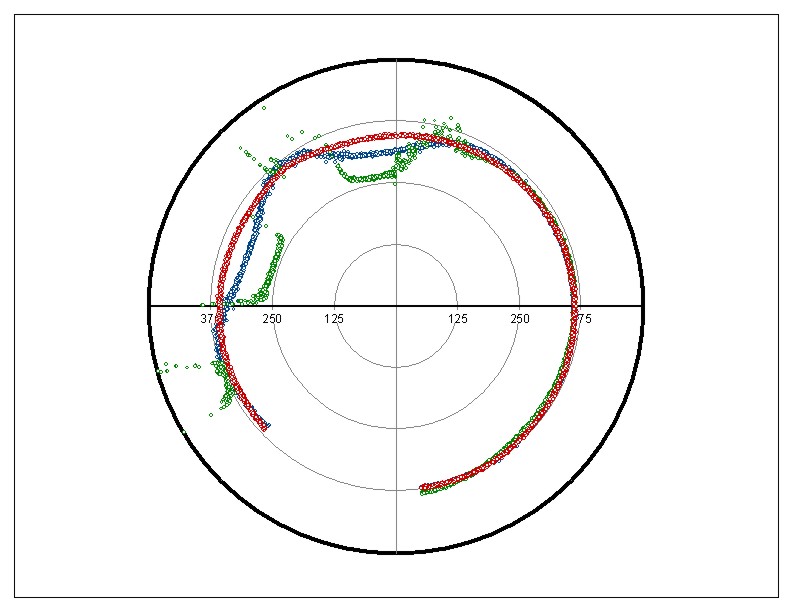
Dr. Mark E. Barkey
Professor of  Aerospace Engineering and Mechanics
The University of Alabama
Structural Durability and Fatigue Performance Group

Pressure Testing of Recyclable Transmission Lines (RTL's)

Toledo Metal Spinning Cone Results


T7 cone
The T7 cone was laser scanned for its initial and deformed shapes.  The initial geometry
scan was conducted in the 180-degree orientation and the usual orientation so that the
intial geometry could be caputured all the way around the cone.  The scans were conducted
every one inch of depth into the cone.
Below is a plot of the pressure vs. time data for this test.  The testing period was quite
long due to the need to laser scan the cone at several pressure values.  For the initial buckling
at 1.55 psi, two segments collapsed at the same time.  At the ultimate buckling pressure, two
more segments buckled.  As the pressure was being held below 1.50 psi for measurements,
the cone collapsed at the pressure could no longer be maintained.


Results of Mode-Shape Scans

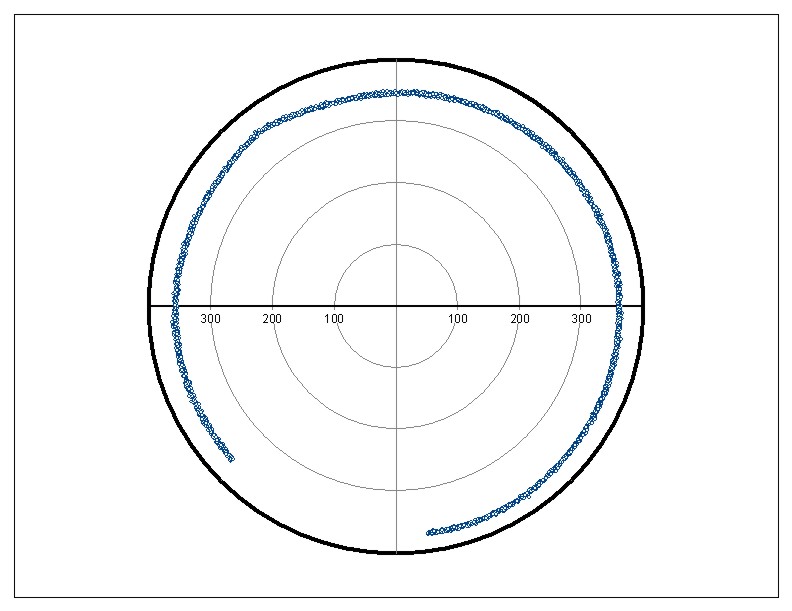
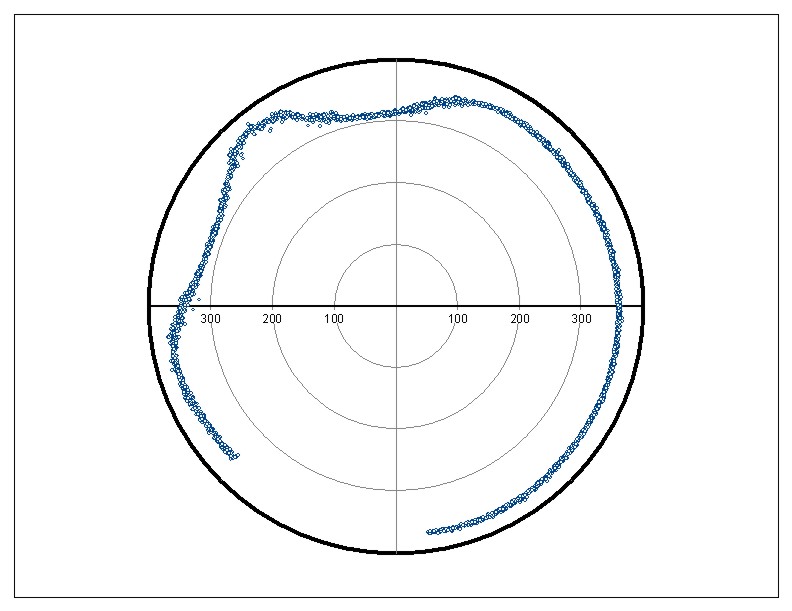
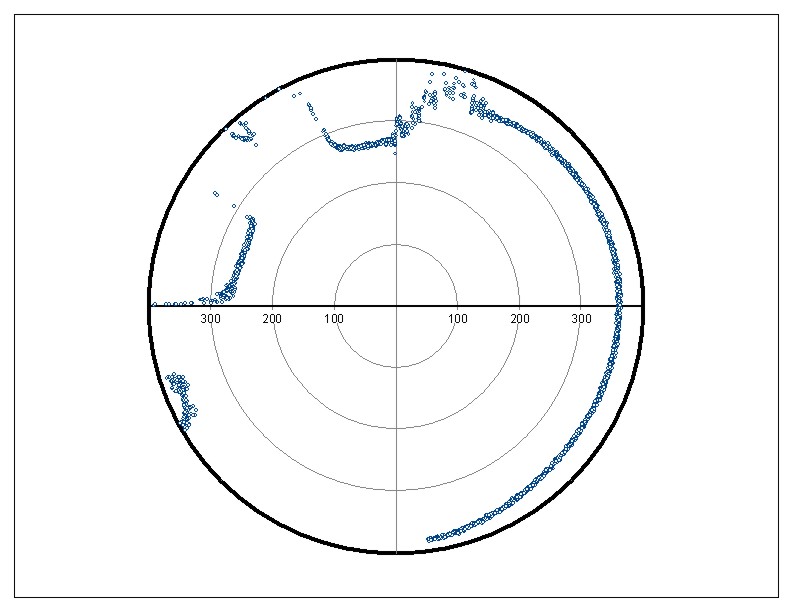
The following  figures show the initial shape and the results of the scans as portions of the cone
began to buckle.  The second plot is after the initial formation of two "lobes" of buckled cone.
The third figure is after a total of four lobes, at zero pressure after it had reached its collapse load.
These plots are polar coordinate plots at a depth of about 610 mm into the cone.

As the deformation became more severe, the laser scanner was unable to get a line of sight to every
part of the cone, so some spurious data was introduced.  Most of this has been filtered out, but some
remains and can be seen in the figures.
 

The following plot is a superposition of the three preceeding plots.  The progression of buckling
is from red-blue-green.