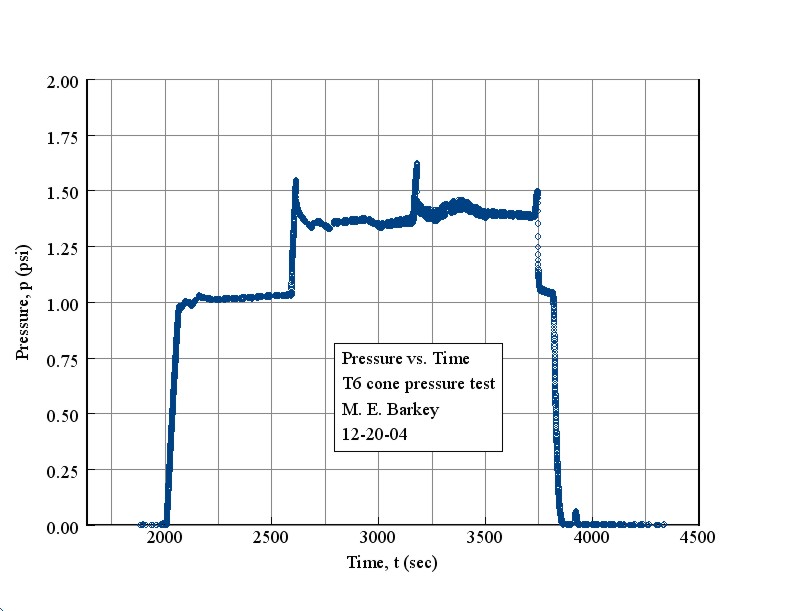
Below is a plot of the pressure vs. time data for this test. The testing period was quite
long due to the need to laser scan the cone at several pressure values.
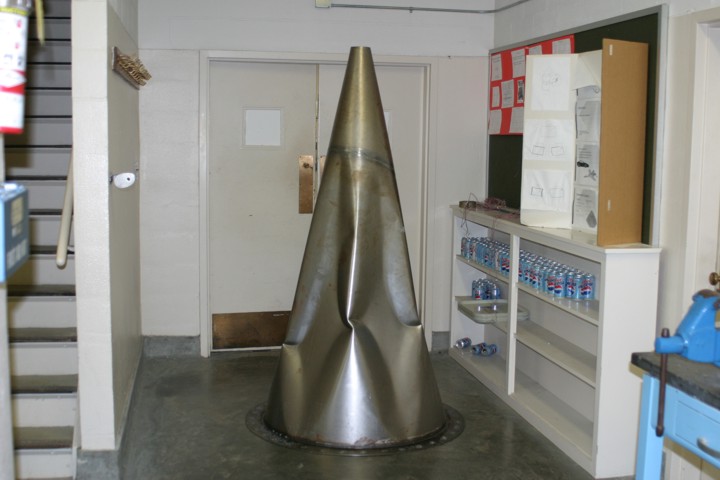
T6 coneThe T6 cone was laser scanned for its initial and deformed shapes.
Below is a plot of the pressure vs. time data for this test. The testing period was quite
long due to the need to laser scan the cone at several pressure values.
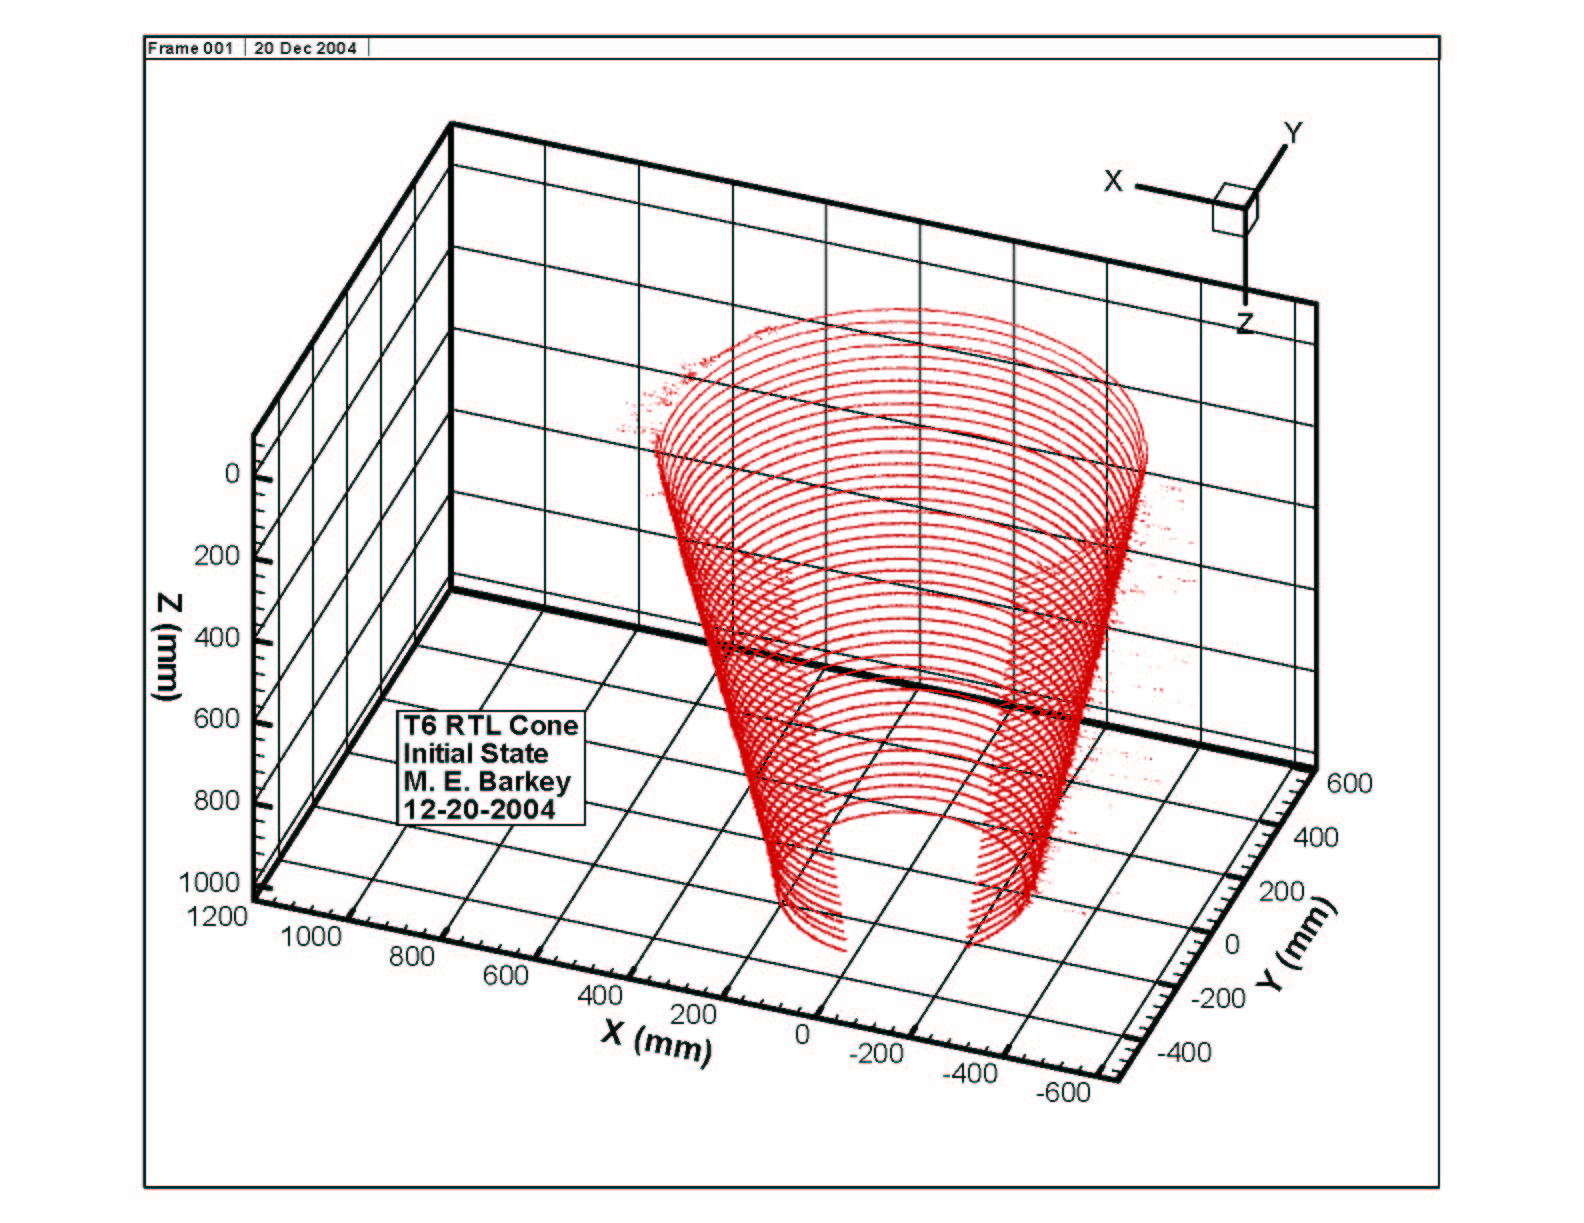
The laser scanner was used to determine the initial shape. A scan was conducted
at each inch along the depth of the cone. More information about this particular
test can be found on this page: T6.
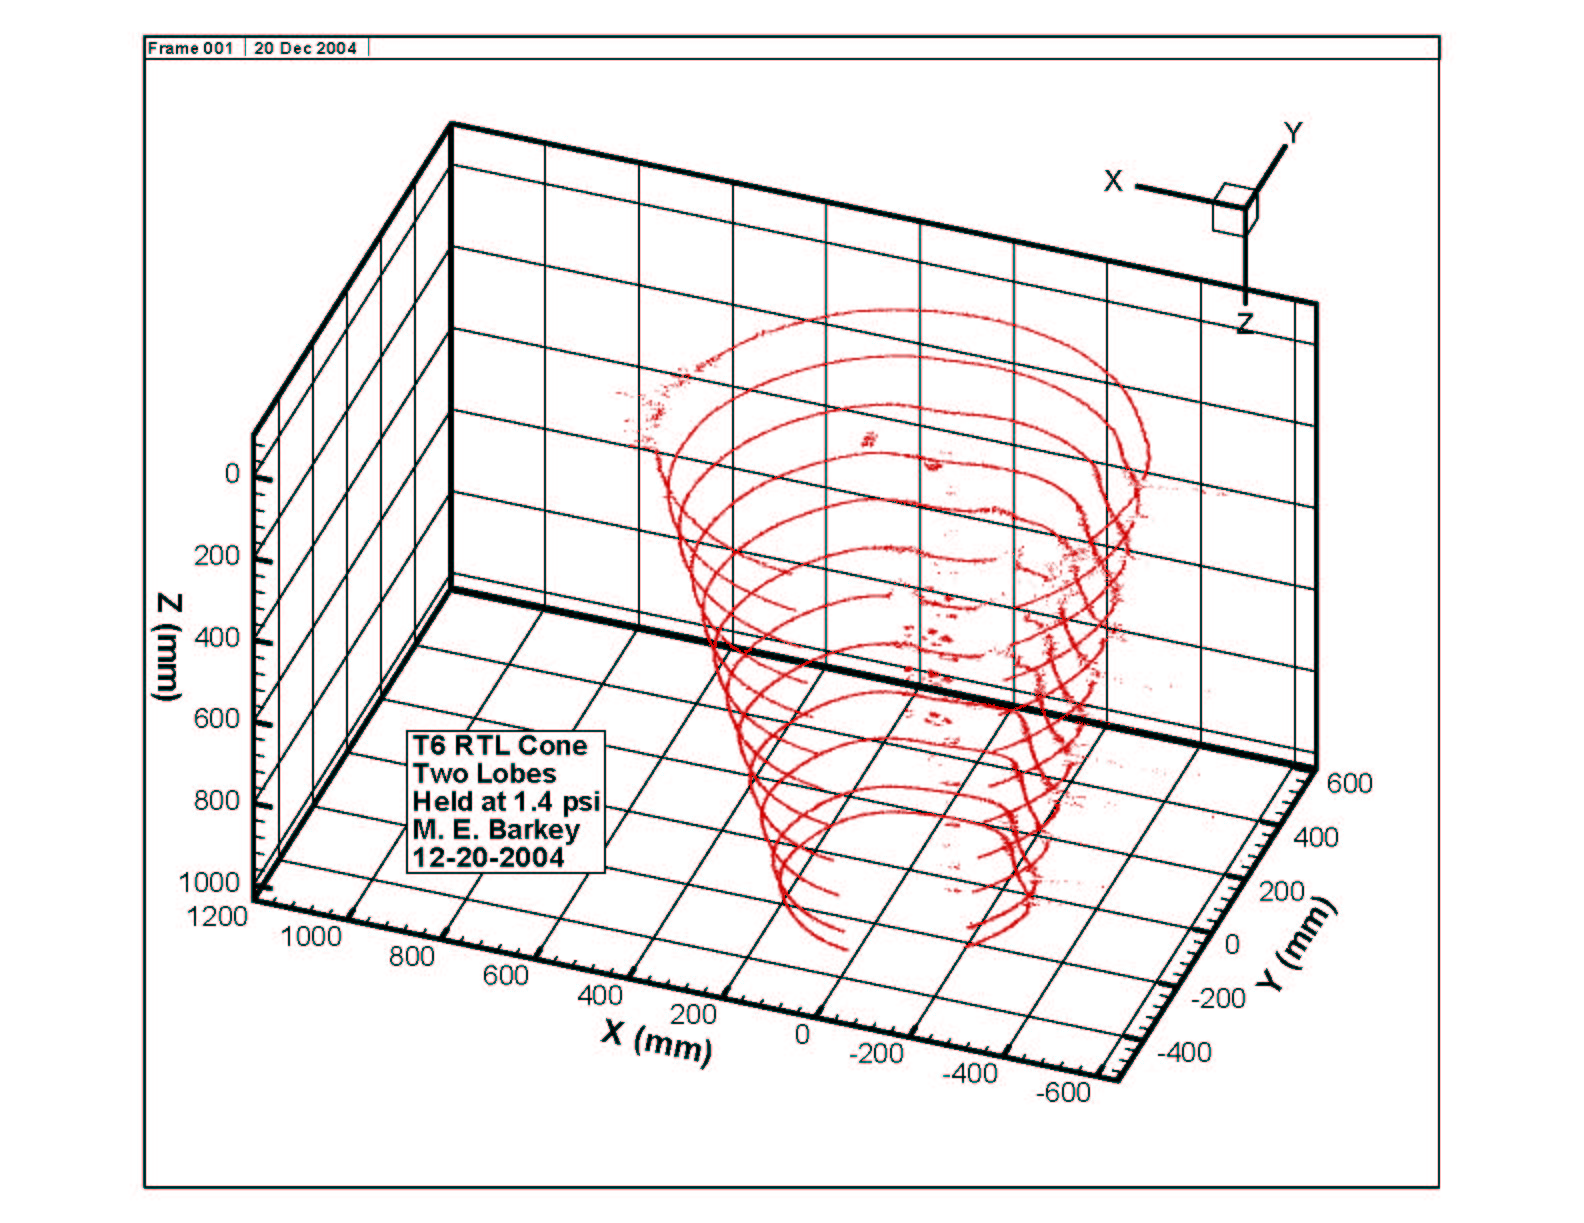
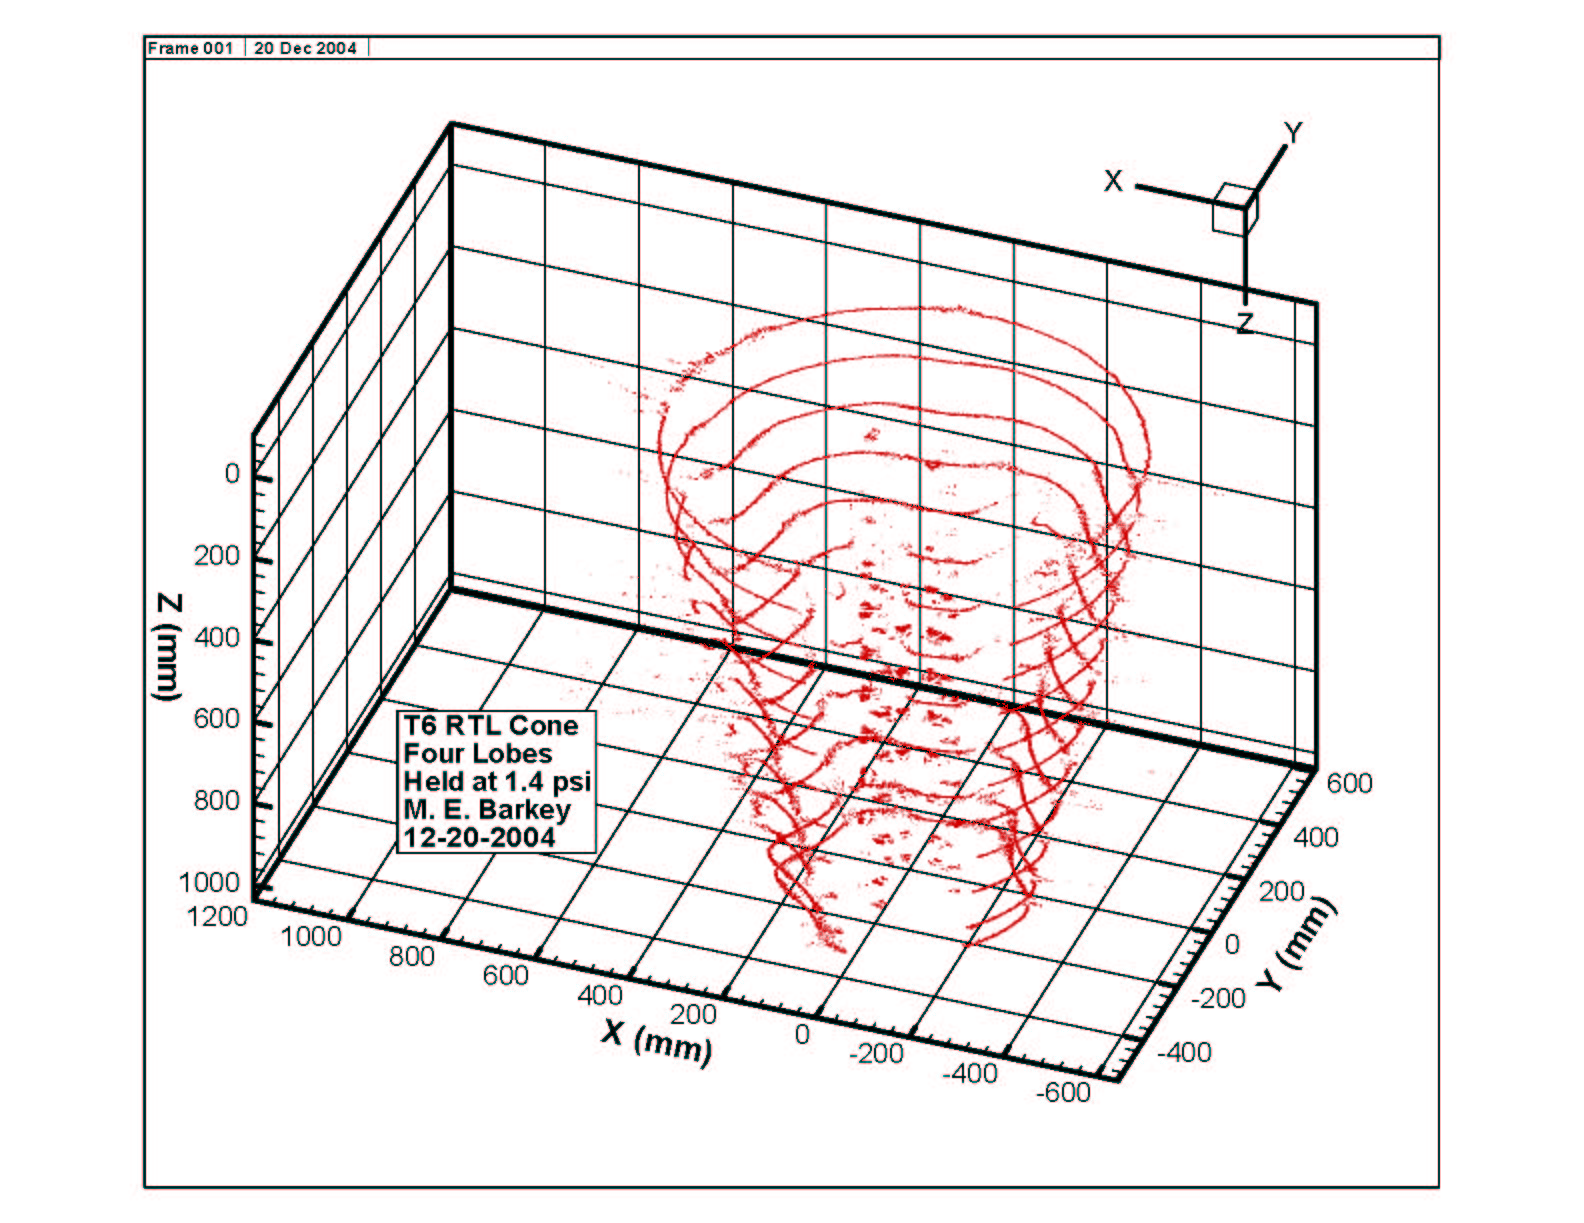
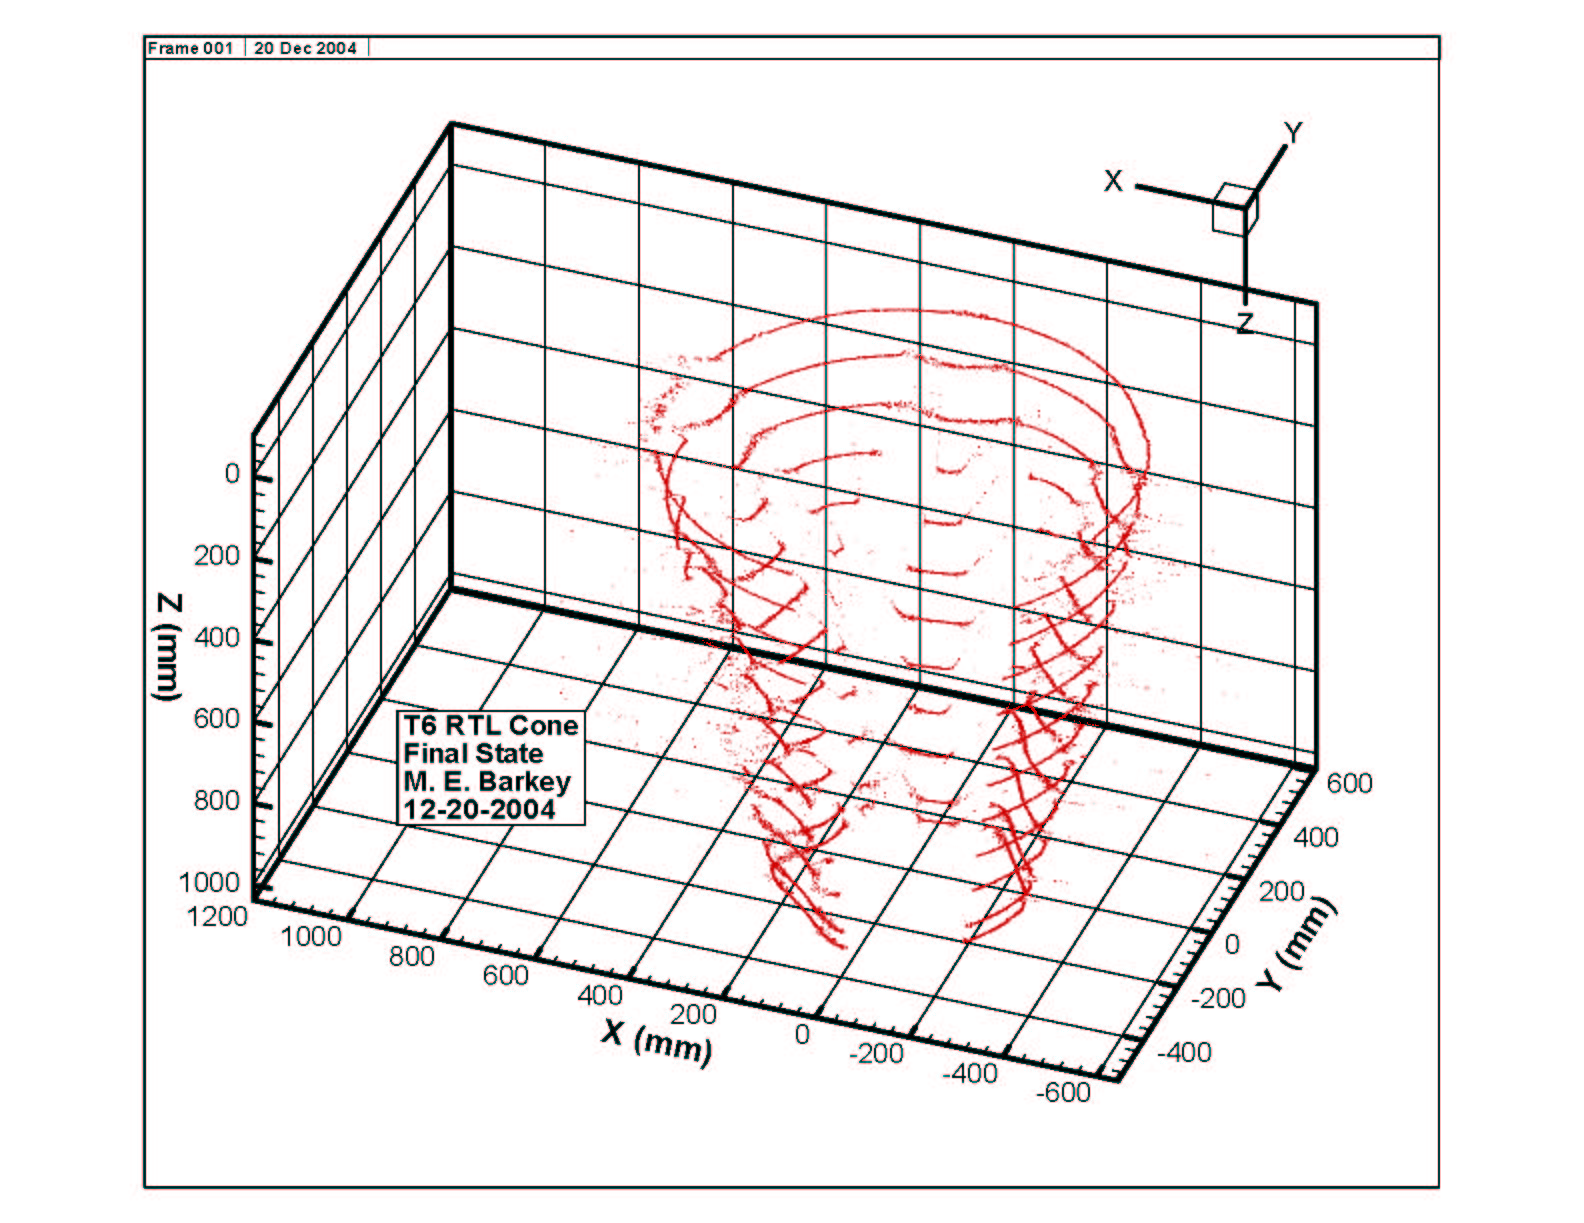
The following three figures show the results of the scans as portions of the cone began to buckle. The
first plot is after the initial formation of two "lobes" of buckled cone. The second figure is after a total
of four lobes, and the last plot is at zero pressure after had reached its collapse load.As the deformation became more severe, the laser scanner was unable to get a line of sight to every
part of the cone, so some spurious data was introduced. Most of this has been filtered out, but some
remains and can be seen in the figures.
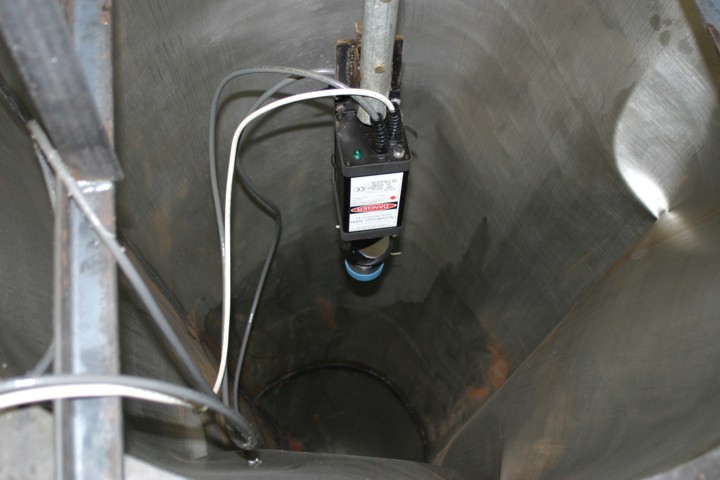
Photos of the Collapsed ConeBelow are some photos taken during and after the pressure test of the T6 cone.